Flow Cytometry
Flow Cytometry Services
Minerva Imaging offers advanced, state-of-the-art flow cytometry resources to support all aspects of immune monitoring. We provide pre-defined panels to detect and characterize a broad spectrum of cells involved in the cellular immune response. Alternatively, design customized panels to match your cancer immune monitoring. See a list of our panels below.
Flow Cytometry Resources
Flow cytometry is a powerful tool to assess single-cell immune profiles in pre-clinical and clinical settings. Our scientific team has extensive experience with the selection of animal models, and how to characterize complex immune phenotypes and rare cells in the tumor micro-environment, peripheral blood, or lymphatic organs. Flow cytometry can be the essence of your study, or you can add an ex vivo flow cytometry arm to any in vivo study to uncover new insights about your research program.
Typical services include:
- Analysis of radioactive samples
- Immunophenotyping
- Expression profiling
- Target identification
- In vivo time series
- T cell activation/exhaustion
- Cell-based assays
Flow Cytometry:
- ≥100 mW 5 laser BD FACSymphonyTM A3 (≤30 parameters)
- Multiparametric analysis with excellent performance and consistency
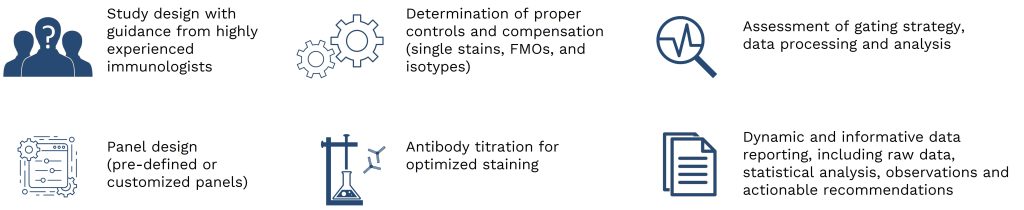
Support and Guidance:
Our scientific team will accompany and see through every phase of the project, from understanding your specific requirements to designing, setting up, and successfully deploying the flow cytometry assay. You can count on transparent communication, professional support, and advanced scientific insights to keep your research moving forward.
Predefined panels
Broad phenotyping with activation (17 colors):
- Provides a broad overview of the immunological microenvironment in any given tissue
- Covers key myeloid and lymphoid populations, and activation marker expression in these subsets.
- CD4+ T cells
- CD8+ T cells
- NK cells
- B cells
- Monocytic MDSCs (Mo-MDSCs)/classical monocytes,
- Polymorphnuclear MDSCs (PMN-MDSCs)/neutrophils,
- Classical dendritic cell 1 and 2
- Tumor-associated macrophages/macrophages
- Markers: CD45, CD3, CD4, CD8, CD11b, CD11c, CD19, CD64, CD68, CD69*, CD86*, CD206*, Ly6c, Ly6g, MHCII, NKp46, viability dye (* = changeable markers).
- Includes flexibility by having three changeable markers to decipher your specific focus. Examples of focus could include
- Evaluation of enhancement of antigen presentation using e.g. CD80, CD86, IL-12, MHC II and MHC I bound epitopes (in a few models)
- Evaluation of suppressive markers such as IL-10 and PD-L1
- Evaluation of macrophage polarization markers such as CD80, CD86, CD163, CD206 and PD-L1
- Evaluation of cancer antigen specificity using MHC multimers
- Evaluation of regulatory T cells using FoxP3
- Evaluation of T cell phenotypes using e.g. CD44, CD62L, CTLA4, PD-1, Granzyme B and IFNγ
The data below displays analysis in murine tumors using an MC38 murine colon carcinoma model (n=6) using tetramer staining instead of CD69.
![]()
(A) Infiltration of evaluated immune subsets (B) Viability and overall immune infiltration (C) Tumor-associated macrophage (TAM) polarization into M1 and M2 subsets based on CD86 (M1 marker) and CD206 (M2 marker). The M1 TAM phenotype supports T cells and are regarded as anti-tumorigenic while the M2 TAM phenotype suppresses T cells and are regarded as pro-tumorigenic.
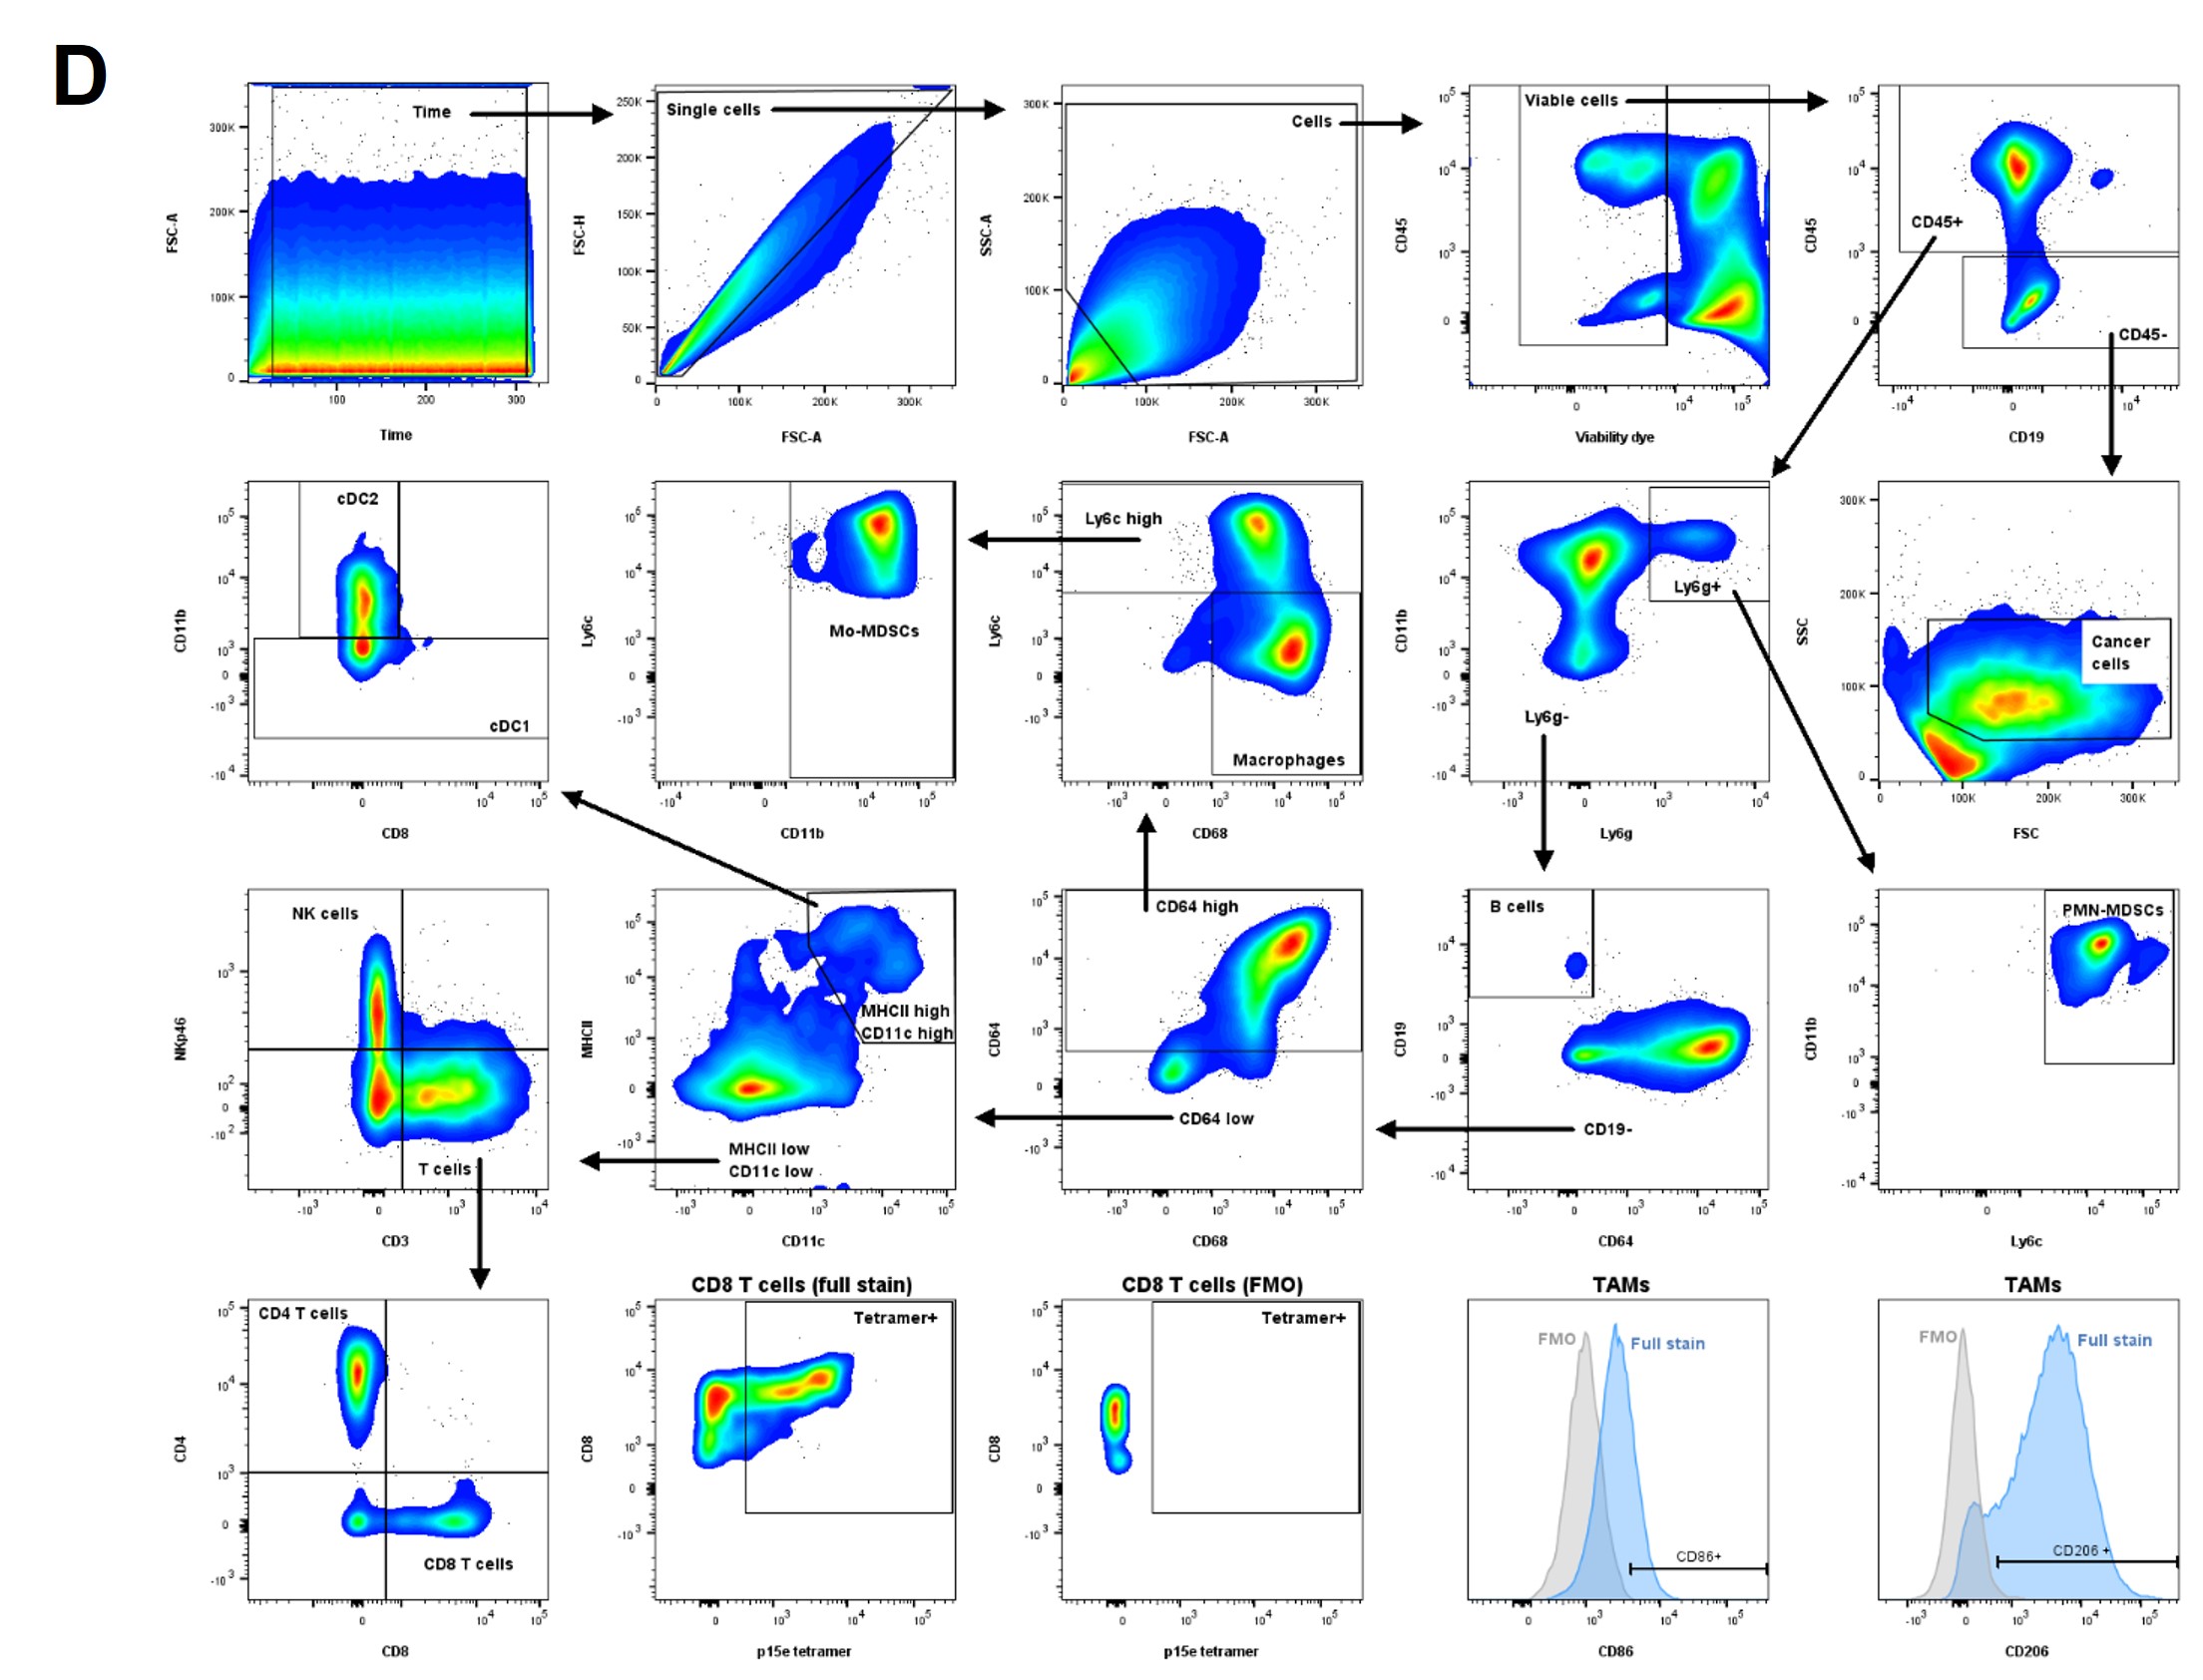
(D) Gating strategy
T and NK cell phenotyping (13 colors):
- Provides an extensive analysis of T cell subsets in any given tissue
- Covers T cells and NK cells including comprehensive phenotyping
- Markers: CD45, CD3, CD4, CD8, CD25*, CD44*, CD49b/CD335, CD62L*, FoxP3*, IFNγ*, PD1*, MHC multimer*, viability dye. (* = changeable markers).
- Includes flexibility by having seven changeable markers to decipher your specific focus. Examples of focus could include
- Evaluation of T cell exhaustion using PD-1, CTLA-4, TIM3, KLRG1
- Evaluation of proliferation using Ki-67
- Evaluation of adoptively transferred cells using CellTrace or CD45.1/2
- Evaluation of cytotoxicity using CD107a (degranulation), IFNγ, perforin and granzyme B
- Evaluation of cytokine production including IL-2, IL-4, IL-9, IL-10, IL-17, TNF-α, TGF-β
- Evaluation of effector/memory phenotypes using CD44 and CD62L. CD8+ memory Stem T cells (TSCM) can be included using a combination of CD122, BCL-2 and Sca-1
General myeloid phenotyping (17 colors):
- Provides an extensive overview myeloid and selected lymphoid subsets in any given tissue
- Covers several key populations and activation marker expression in some of these subsets
- Monocytic MDSCs (Mo-MDSCs)/classical monocytes,
- Non-classical monocytes
- Polymorphnuclear MDSCs (PMN-MDSCs)/neutrophils,
- Eosinophils
- Plasmacytoid dendritic cells
- Classical dendritic cell 1 and 2 including migrating subset (CD103+)
- Tumor-associated macrophages/macrophages
- Markers: CD45, CD11b, CD11c, CD19, CD64, CD68, CD103*, CD86*, CD206*, CX3CR1, Ly6c, Ly6g, Siglec-F, Siglec-H, MHC II, XCR1, viability dye. (* = changeable markers).
- Includes flexibility by having two changeable markers to decipher your specific focus. Examples of focus could include
- Evaluation of enhancement of antigen presentation using e.g. CD80, CD86, IL-12, MHC II and MHC I bound epitopes (in a few models)
- Evaluation of suppressive markers such as IL-10 and PD-L1
- Evaluation of macrophage polarization markers such as CD80, CD86, CD163, CD206 and PD-L1